

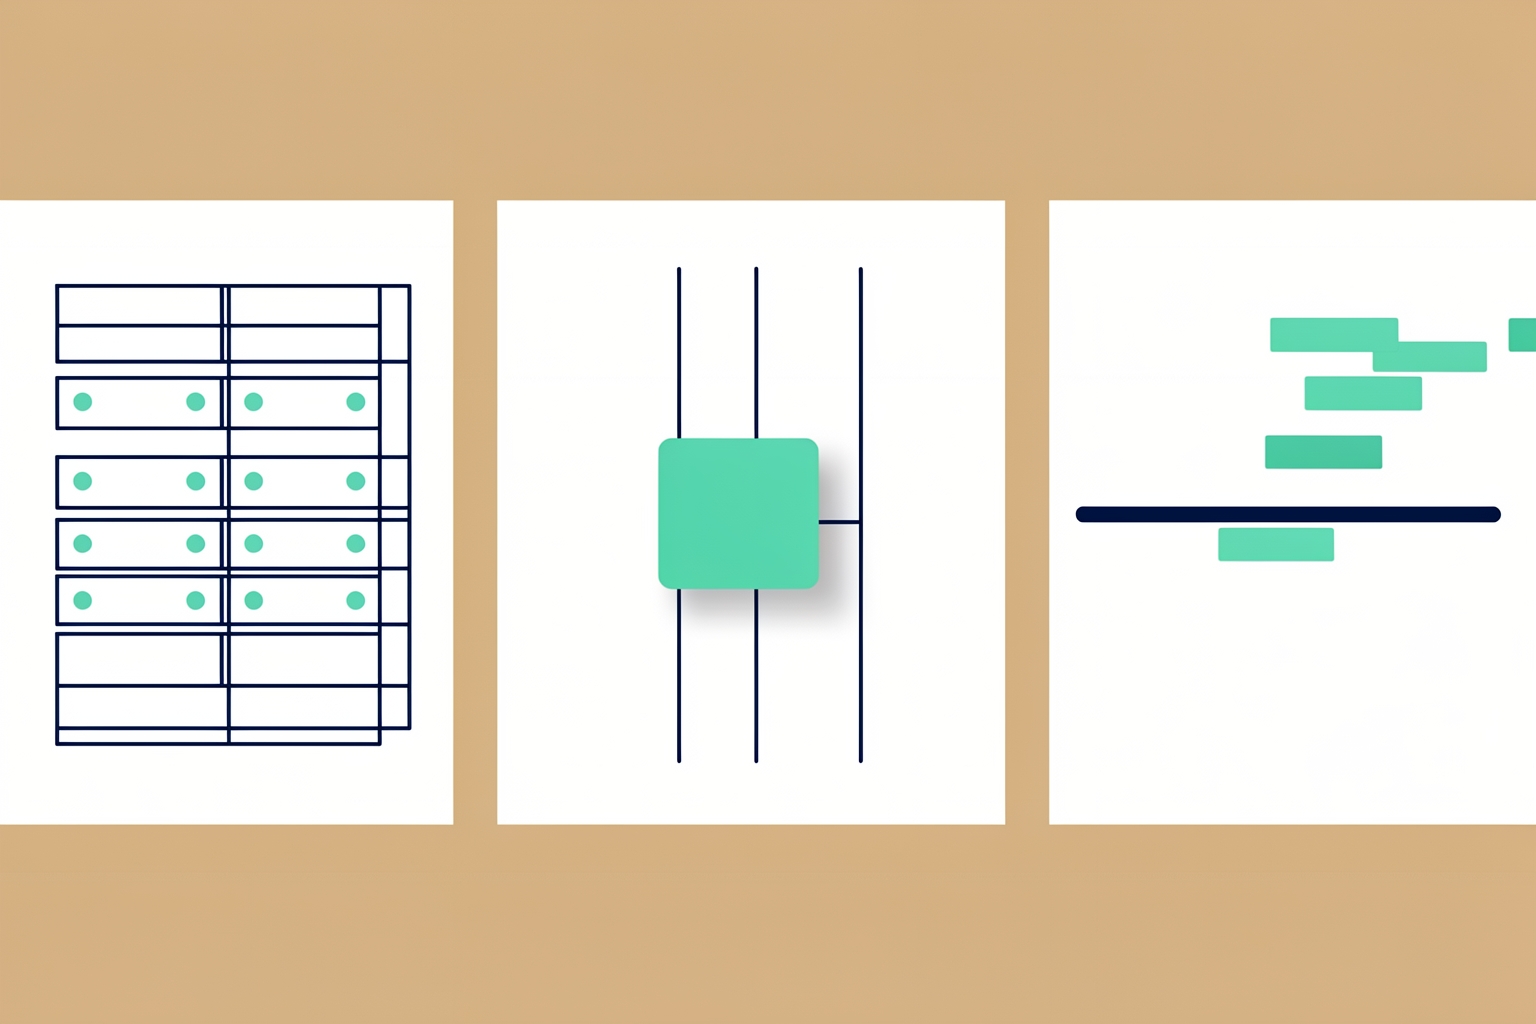
What the three layouts have in common
GitHub Projects gives you three ways to look at the same work: a table, a board and a roadmap.
The items, fields and filters stay the same.
Only the shape of the view changes.
Picking the right shape for each situation saves you from rebuilding your project every few weeks.
This guide explains what each layout does, when it fits, and how to switch between them.
Every layout fact here comes from GitHub's official documentation on changing and customizing project views.
All three layouts show the same underlying items: your issues, pull requests and draft issues, together with GitHub metadata and any custom fields you have added to the project.
You are not choosing between three separate tools.
You are choosing how to present one dataset.
You can set each view in your project to a different layout.
Open the view, click View next to the search bar, and under Layout choose Table, Board or Roadmap.
Because views are separate, you can keep a table view for planning, a board view for daily work and a roadmap view for deadlines, all inside one project.
The table layout: a spreadsheet for your work
The table layout is a high-density spreadsheet built from your items and fields.
GitHub describes it as powerful and adaptable, and the customization options back that up.
You can group, sort and filter items, show or hide fields, reorder rows and columns, and slice items by a field value in a side panel.
Two table behaviors are worth knowing before you start dragging things around.
First, when items are grouped, dragging an item into a new group applies that group's value to the item.
If you group by Status and drag an item marked In progress into the Done group, its status switches to Done.
Second, you cannot group or slice by title, labels, reviewers or linked pull requests, so plan your custom fields around the ways you actually want to organize work.
The table also supports field sums.
If you track estimated hours in a number field, you can display the sum of those hours per group, which turns the table into a lightweight capacity view.
When the table fits best
Choose the table when you need to see many fields at once and make decisions across the whole backlog.
Typical situations: